As your IT environments become larger and more complex, monitoring and alerting becomes a critical component of ensuring that your systems remain online and healthy. By collecting data about the state of your system you can be notified if a host goes down or get advance warning of an impending issue such as a disk running out of space. Storing this data allows you to analyse it later to troubleshoot more complex or transient issues by correlating data from multiple sources to gather a clearer picture of how components of your environment are interacting.
One such monitoring and alerting tool is Zabbix Server which is able to collect data from a vast range of device types using either an installed agent or, in the case of networking equipment, SNMP. Compared to other open source monitoring solutions such as Nagios, Zabbix is generally simple to set up, comes with a good selection of pre-configured data collection and alerting templates and doesn’t require enterprise licensing to access the more advanced features.
At the time of writing the latest version of Zabbix is 4.4 and the current long term support (LTS) version is 4.0. In general, the x.0 releases are LTS and supported for 5 years while the interim versions only have a 6 month support lifecycle to allow for faster development. For this guide I will be installing Zabbix 4.0 on CentOS 8.
Prepare your system
As per Zabbix’s recommendation, for a small to medium deployment monitoring up to about 500 hosts, we will provision a VM or physical server with at least 2GB of RAM and 2 CPU cores. We will also want to make sure we have enough disk space to store all the data we collect. As the amount needed will depend on how long you want to store historical data and the number of events your hosts generate it is hard to predict exactly how much is likely to be needed but 50GB should suffice in most cases and, as Zabbix monitors disk space, it will alert you if it is close to running out.
From the base install, install of CentOS, install any available updates and set a static IP address by running the following commands:
dnf -y update
nmcli con mod [network interface name] ipv4.address [your chosen IP address]
nmcli con mod [network interface name] ipv4.gateway [gateway IP address]
nmcli con mod [network interface name] ipv4.dns [your DNS server IP address]
nmcli con mod [network interface name] ipv4.method manual
nmcli con up [network interface name]
Finally, as Zabbix is a networked service you will need to allow incoming connections in the firewall:
firewall-cmd --add-port=80/tcp --add-port=10051/tcp --permanent
firewall-cmd --reload
Install the Zabbix packages
Usually the versions of Zabbix in distribution software repos are somewhat out of date so the Zabbix project hosts its own repos for each supported distribution. Each major version is hosted in its own repo, meaning you can continue to get updates and bug fixes for as long as the release is supported without getting rolled over to the next version. When the time comes to do an upgrade to the next major version you would disable the repo you have been using, enable the one for the version you want to move to and then do a package update to move to the new version. You can find the details of the repo you need to add from the Zabbix downloads page. As we are using Zabbix 4.0 on CentOS 8 we add the repo as follows:
rpm -Uvh https://repo.zabbix.com/zabbix/4.0/rhel/8/x86_64/zabbix-release-4.0-2.el8.noarch.rpm
dnf clean all
We can now install the required Zabbix packages:
dnf install zabbix-server-mysql zabbix-web-mysql zabbix-agent mariadb-serverConfigure the database
Before we enable MariaDB for the first time we need to work around an issue where some of the Zabbix table lengths exceed the maximum allowed size in the default MariaDB configuration. Edit the [mysqld] section of the file /etc/my.cfg.d/mariadb-server.cfg to contain the following lines:
innodb-strict-mode=1
innodb_page_size=65536
innodb_log_buffer_size=33554432
innodb_buffer_pool_size=536870912
innodb_default_row_format=dynamic
Please note that this is not possible to do this after the server has been initialised (i.e. after the first time you start the service). If you have started the server but don’t yet have any databases on it you can reset it back to an uninitialised state by running:
systemctl stop mariadb.service
rm -rf /var/lib/mysql/*
Please note that the above command will wipe any data stored in the database server so don’t do it if you are using the server to host any other databases. If that is the case you can disable the innodb strict checking before importing the initial database schema and then enable it again afterwards. The SQL commands to do this are:
set global innodb_strict_mode='OFF';
set global innodb_strict_mode='ON';
Perform the standard MariaDB setup to start and enable the database, set a password for the root user, block anonymous access, disable remote root login and remove test databases as follows:
systemctl enable mariadb.service
systemctl start mariadb.service
mysql_secure_installation
Open the MariaDB client as the root user:
mysql -uroot -pRun the following commands to create the Zabbix database and grant the Zabbix user permission to manage it:
create database zabbix  character set utf8 collate utf8_bin;
grant all on zabbix.* to 'zabbix'@'localhost' identified by '[some secret password]';
flush privileges;
quit;
Import the database template into the Zabbix database. You’ll do this as the Zabbix user so you will be prompted to enter the password you just set. If you chose a different name for your user and your database adjust the below command accordingly, in our case both are ‘zabbix’:
zcat /usr/share/doc/zabbix-server-mysql*/create.sql.gz | mysql -uzabbix -p zabbix The command will take a little while to import all of the tables but once it is complete we can verify that the import has been successful by running the following commands:
mysql -uroot -p zabbix
show tables;
quit;
You should see a long list of tables in the output. If it is blank or says there are no tables, you may have made an error so go back and check.
Finally, we need to tell Zabbix the credentials to use for the database, edit the file /etc/zabbix/zabbix_server.conf and enter the database information in the following lines:
DBName=zabbix
DBUser=zabbix
DBPassword=[your chosen password]
Set the correct time zone
We now need to set the time zone Zabbix will use to store event information. You can use the same time zone as your system clock but this is not required. For example, if you are monitoring systems in multiple time zones you may want to use UTC to ensure consistency between systems. You can view the list of available time zones by running:
timedatectl list-timezonesOnce you know which time zone you will use, edit /etc/php-fpm.d/zabbix.conf to uncomment the line php_value[date.timezone] and set the value to your chosen time zone.
Configuring SELinux
If you are running SELinux on your server (you should be), you will need to make a couple of changes to get it to play nicely with Zabbix. Run:
setsebool -P httpd_can_connect_zabbix on
setsebool -P daemons_enable_cluster_mode on
This allows the Zabbix web frontend to talk to the Zabbix backend. Additionally, you may need to compile a custom module to get the Zabbix server to start. To test if this will be needed run:
systemctl start zabbix-server.serviceIf you get an error, install the policycoreutils-python-utils package and compile a custom policy as follows:
dnf -y install policycoreutils-python-utils
grep "comm.*zabbix_server.*zabbix_t" /var/log/audit/audit.log | audit2allow -M comm_zabbix_server_zabbix_t
semodule -i comm_zabbix_server_zabbix_t.pp
rm comm_zabbix_server_zabbix_t*
If you attempt to start Zabbix server again it should start without any issues.
Start and enable the Zabbix server
We are now ready to start up the Zabbix server, agent and frontend:
systemctl restart zabbix-server zabbix-agent httpd php-fpm
systemctl enable zabbix-server zabbix-agent httpd php-fpm
Configure the web interface
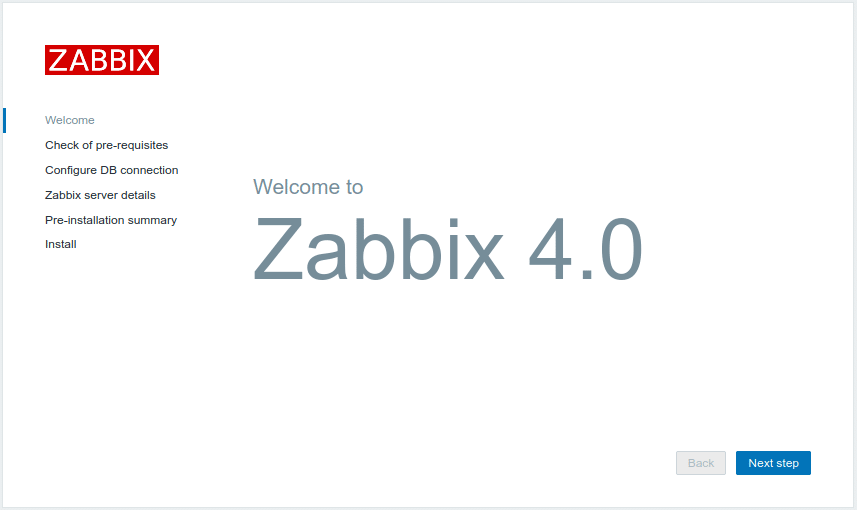
Now open a web browser and navigate to your chosen IP address/zabbix. For example, if your server were on 172.16.24.8 you would go to http://172.16.24.8/zabbix. You will see an installer screen which will allow you to complete the last few installation steps to set up the web interface. Click “Next step” on the welcome screen to begin.
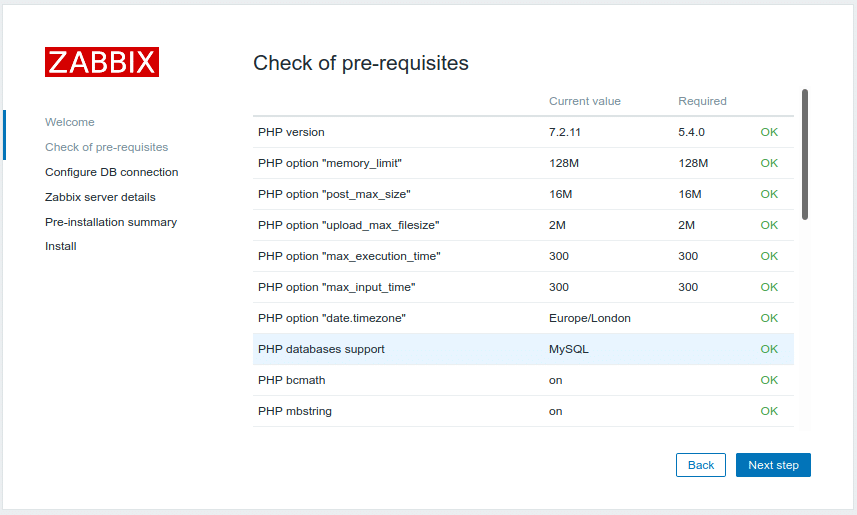
Zabbix will then check the prerequisites. If you have followed this guide you shouldn’t run into any issues here but if you do, you most likely need to install additional PHP packages or edit values in /etc/php-fpm.d/zabbix.conf to match the required value. If all is well click “Next step”.
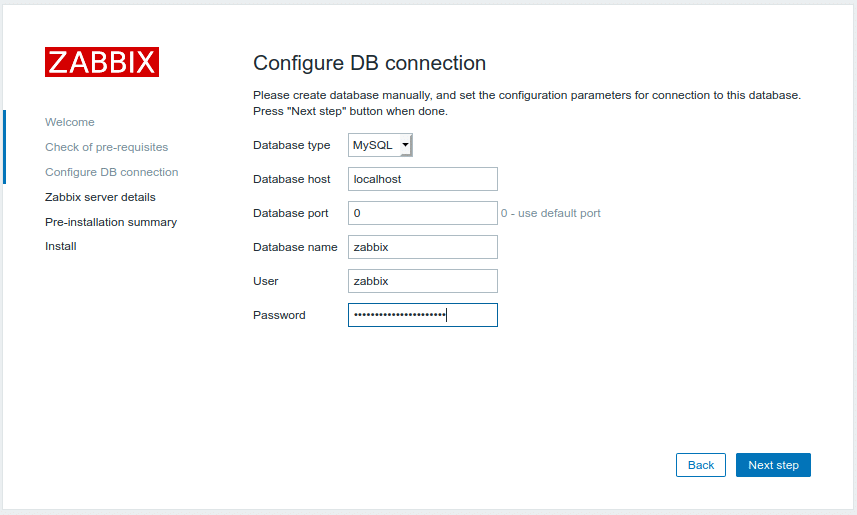
Next we have to tell the web interface how to connect to the database. Enter the same values as you set in /etc/zabbix/zabbix_server.conf:
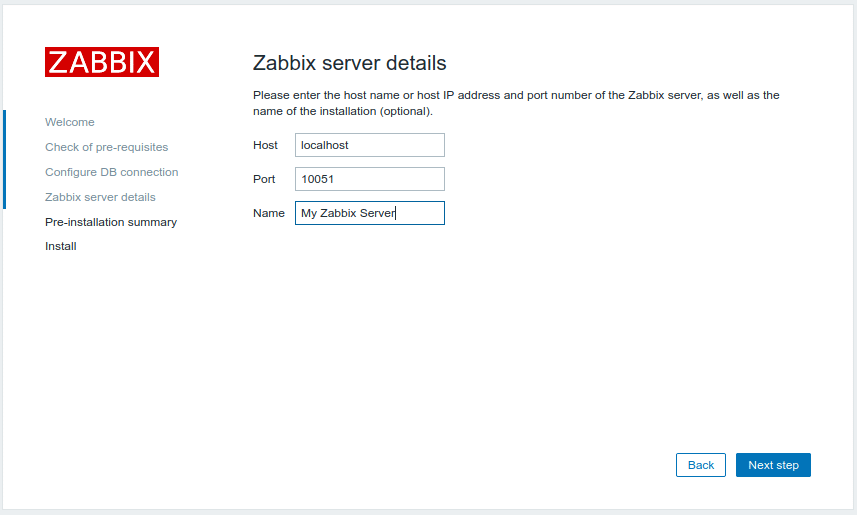
You will next be prompted to tell the Zabbix frontend where it can find the Zabbix server. As we are installing the server and the frontend on the same host, we accept the default value of localhost. You can also optionally give the installation a name of your choosing to identify it:
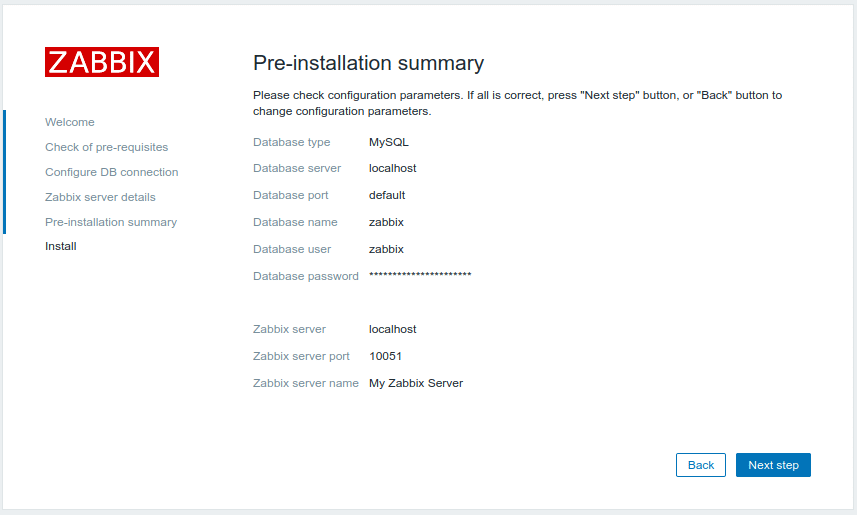
On the last page before the installation, you are given a summary of the settings you have chosen, give them a quick look over to check they all look ok and then go to the next step to begin the installation.
Once the installation is complete, click “Finish” to go to the login screen. Sign in with the default login (Username: Admin | Password: zabbix). Note that the username is case sensitive.
Finishing touches
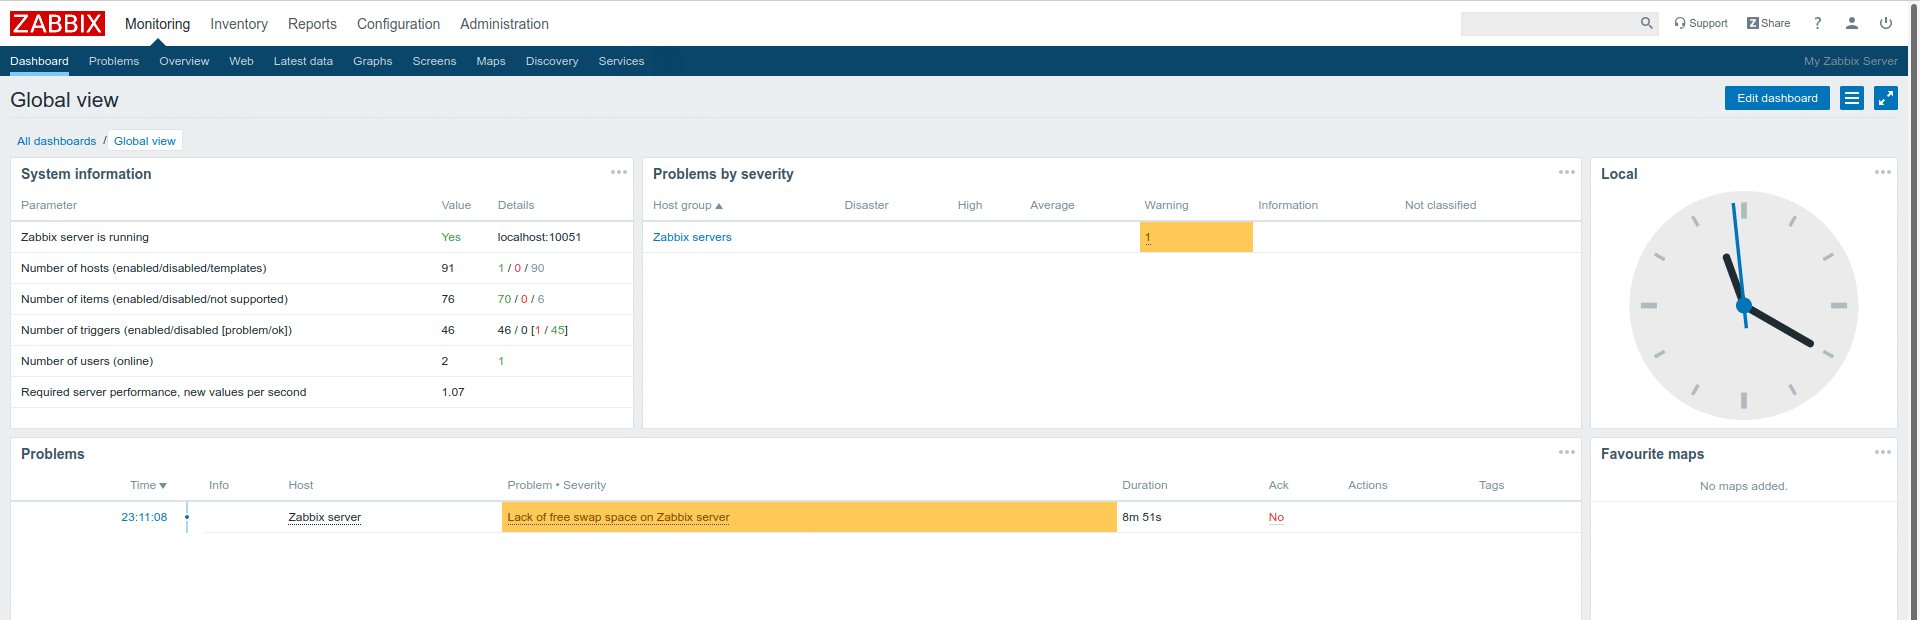
Once you’ve logged in you will see the default dashboard and see that Zabbix has started monitoring itself. In my case we even have an alert that there isn’t enough free swap space. This is unsurprising as I didn’t configure a swap partition on this server but it is useful to confirm that the monitoring and alerting is working as it should be.
The first thing you should do is click the user icon in the top right corner of the screen next to the logout button and change the password. You can also rename the admin user for additional security.
Of course there is little point in having a monitoring server that only monitors itself so you will eventually want to add additional hosts to monitor. For the time being though, play around with the menus and see what data you are able to collect and the kind of alerts that are getting triggered before you start adding more hosts. A key component of monitoring is figuring out what information you’re interested in and tuning your monitoring system to match your needs. While it may seem tempting to gather lots of data and start monitoring hundreds of hosts at once, it is very easy to miss key information when you are overloaded with too many alerts so start slow while you’re testing and learning the system and gradually add hosts to it as you begin to refine your alerts.
Come back soon for future posts on monitoring Windows and Linux hosts, configuring triggers and alerting and adding automation to allow your new monitoring system to scale to large numbers of hosts.