While Zabbix can monitor a lot about the system state through agent and SNMP checks, there are situations where you may want to directly send a notification to Zabbix to inform it of a particular system state or notify it that an action has been performed. One example might be if you want to monitor an automated task such as installing updates or cleaning up temporary files. While it would be possible to write the data from your task out to a log file and have Zabbix parse that file, often the simplest way to do this is with a trapper. The Zabbix sender application allows you to send an item-value pair to Zabbix from the command line, allowing you to monitor the item within Zabbix and create triggers in the event of an error.
For this tutorial I will create a script in /etc/cron.daily that will delete anything older than 10 days from the /tmp folder and post the results to Zabbix. I will then configure Zabbix to generate alerts if the script returns an error code or if it does not receive any data for more than 24 hours.
Install the zabbix-sender application
On the host you want to monitor, you will need to install zabbix-sender. On Windows, the sender is part of the agent installation so if you already have the agent, you also have the sender. On Linux you will need to install the sender separately from the same repo you installed the agent from as follows:
On CentOS:
yum install zabbix-senderOn Ubuntu:
apt install zabbix-senderIf you have not already configured the Zabbix agent and repo on your system refer to my post on installing the Zabbix agent on Windows and Linux systems for instructions on how to do this.
Writing your script
Create your script to perform whatever task you wish to accomplish. If you just want Zabbix to be notified when the script has run, you don’t really need to do any additional planning here. However, if you want to send a different value to Zabbix depending on the outcome of the script you will need to implement mechanisms to gather information about whether the script has succeeded. For example, if your script contains 10 actions and any one of them failing would constitute a failure of the whole script you will need to track the status codes of each of them or use conditional branching to cause the script to stop in the event of any error.
In the example below, I am running a find command to find and delete files older than 10 days. I will then save the exit code of that command to a variable so it can be sent to Zabbix. The script should be saved in /etc/cron.daily and marked as executable to run it automatically every day.
#! /bin/bash
find /tmp -type f -atime +10 -delete
statuscode=$?
zabbix_sender -c /etc/zabbix/zabbix_agentd.conf -s "$(hostname)" -k temp.cleanup -o $statuscode
The first two lines of the script should be fairly self explanatory, we simply find files in /tmp and delete them if they have not been accessed in over 10 days. We then save the exit code of that command into the statuscode variable to then be passed to Zabbix. The final line is where we actually send the data to Zabbix. The flags and options used are as follows:
| Flag | Description |
|---|---|
| -c | The Zabbix configuration file we will use. This will usually be the same configuration file as we use for Zabbix agent but if you want to send the trapper to a different Zabbix server or use different options for connecting to the server you can use a different configuration file. |
| -s | The hostname that the data will be recorded against. This must match a hostname that exists within Zabbix. Normally it will be the hostname of the server the script is running on but you could have one host post data about another host. For example, if you had a script running on a web server that failed to access a database server you might want the web server to send an alert but the alert be recorded against the database server. |
| -k | The item key that the data will be recorded against. In this case we will make an item called temp.cleanup in Zabbix and the script will record its data there. |
| -o | The actual data to send. This can be any string but in this case we use the value of the statuscode variable. |
Once you have saved the file, don’t forget to run chmod u+x against it to mark it as executable otherwise it won’t run.
Create the trapper item
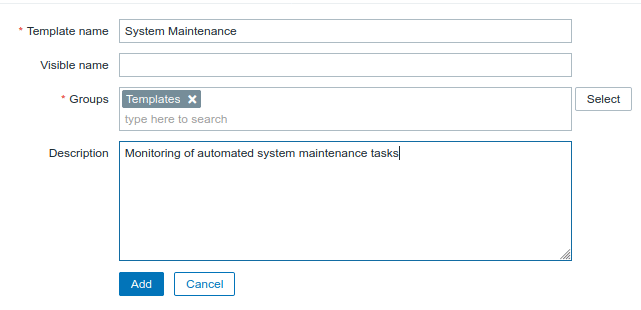
As this is a script which could be adapted for several hosts, instead of just creating a trapper item on the host we want to monitor, we create the item in a template which can then be applied to several hosts. This saves duplicating the effort of creating the item and triggers for every host we want to monitor. In the Zabbix console go to Configuration > Templates > Create template.
Give your new template a name, add it to a group and optionally give it a description. As we may want to collect data on other maintenance scripts I have named the template “System Maintenance” so we can create other items in the template and have them automatically apply to the same hosts without needing to create new templates. Examples of such tasks may be system updates or backups.
Once you have created your template, open it and select the items tab. Click Create item and fill in the details as follows.
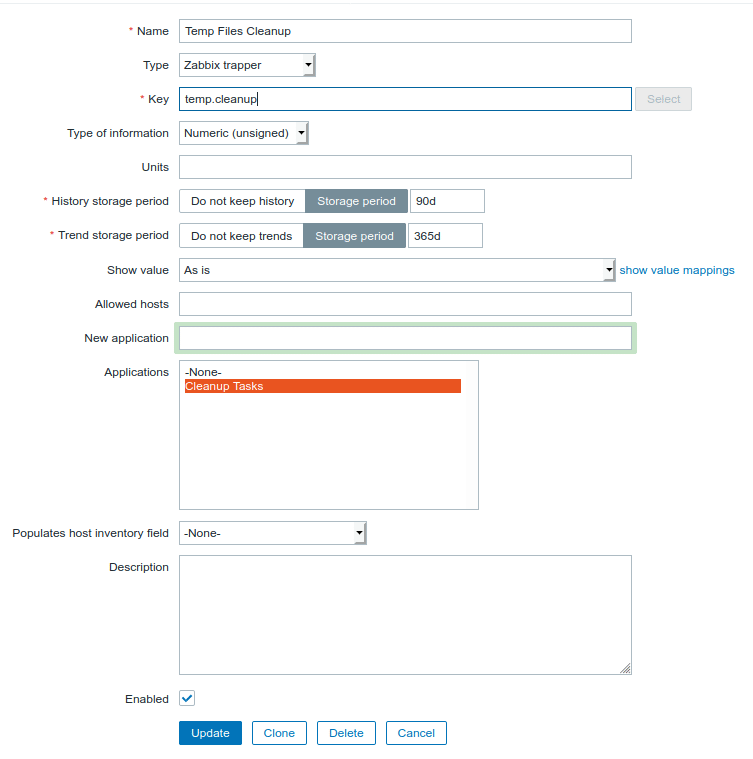
It is essential that the type is set to Zabbix trapper and the Key matches whatever key you are sending in your script. The other options can be adjusted as necessary based on your requirements. Also take note of the type of data as this should match whatever data you plan to send. In this case we are sending an integer number so we select Numeric.
Apply the template to a host
In the Hosts tab, select the host you want to monitor and open its templates tab and add the template you have just created to the linked templates.

You should now be able to go to Monitoring > Latest data and filter by the host you want to monitor and the item name. You will see that there currently is no Last value for the item as the script has not yet been run.
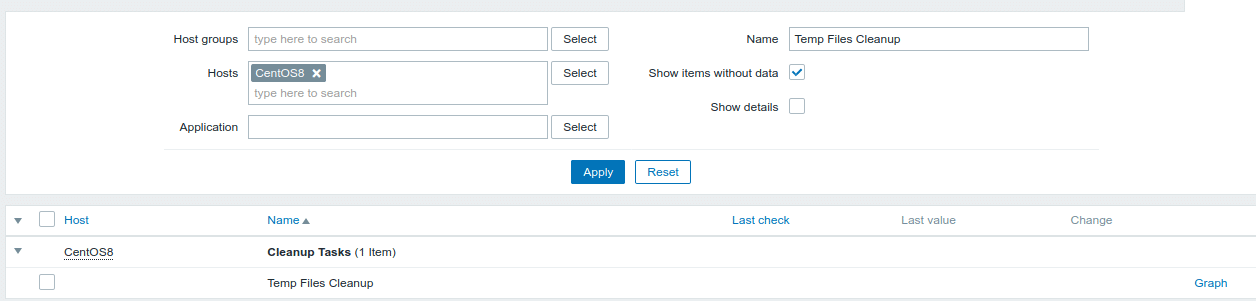
If we now run the script we should see this field update to show the status code of the command. Hopefully this will be “0” but if the script failed for some reason it may be a different number.
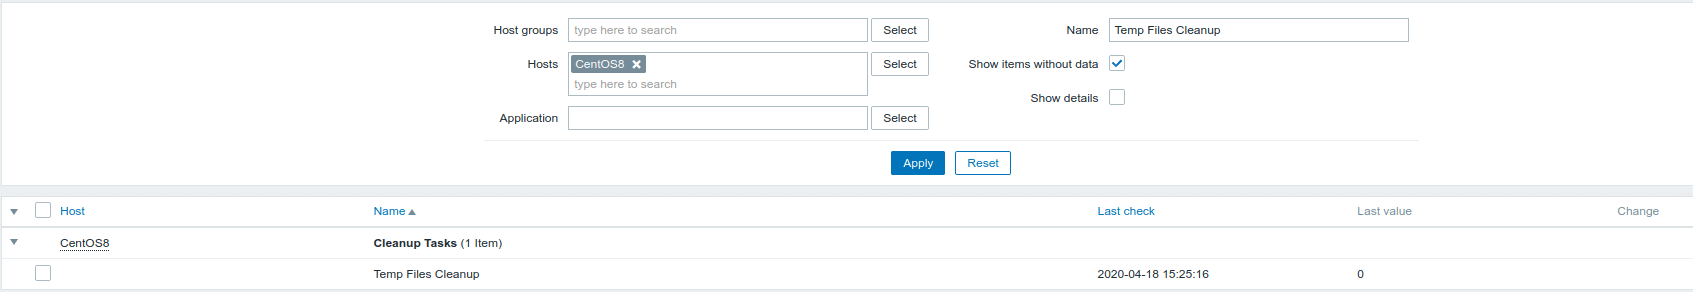
After refreshing the page, we see that the key now has a last check date and a value. As the value is 0 we know the command completed successfully. We can also tell when the information was last received. We can use this to create alerts in the event that the command returns an error code or if it does not appear to get run at all, i.e. no check has been performed in a given time period.
Create the alert triggers
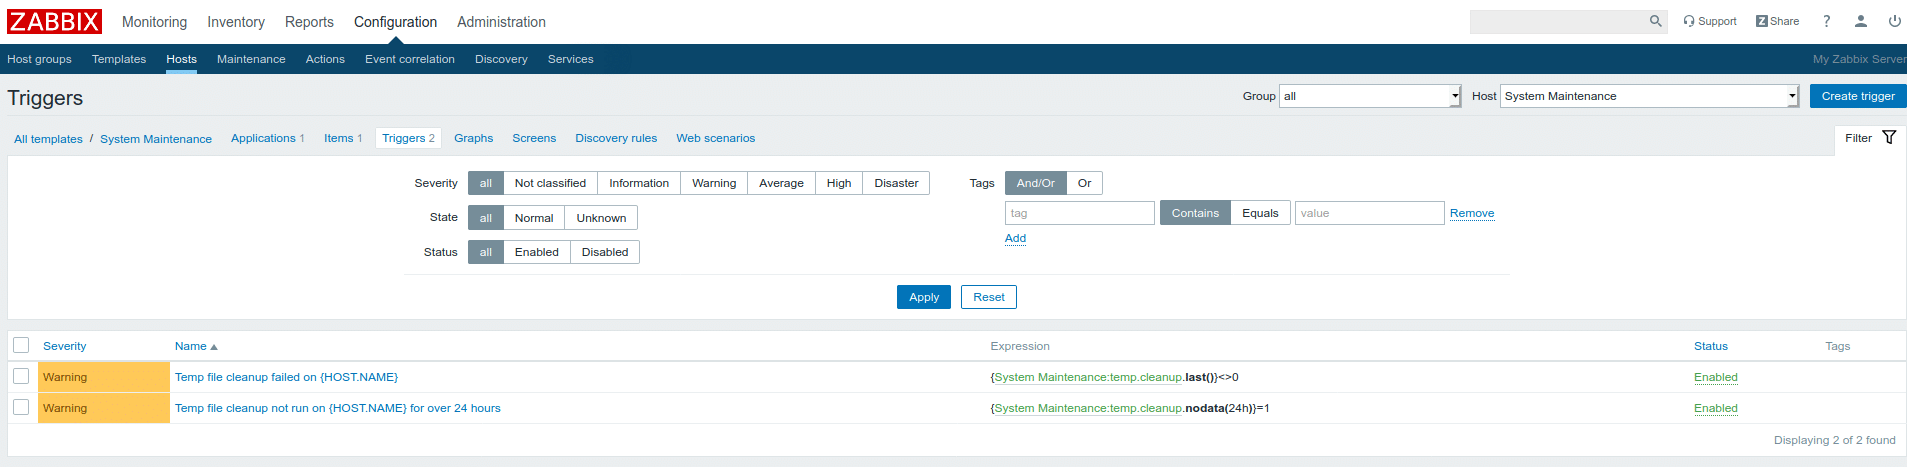
Go back to Configuration > Templates and select the template you created. In the triggers tab click Create trigger. We will create two triggers to identify both anticipated failure conditions, one will check if the most recent value is not 0, the other will check if a value has been received in the last 24 hours.
Set the trigger options as follows:
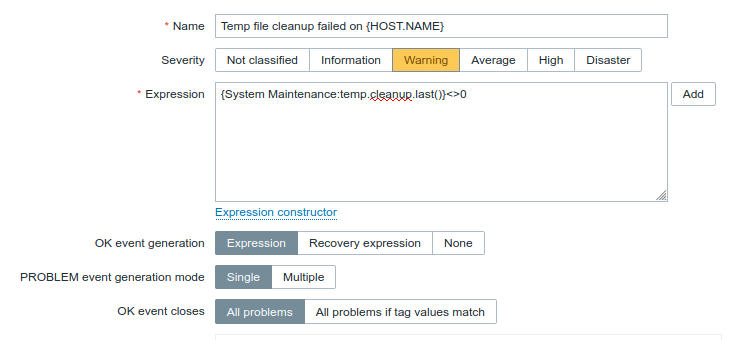
The {HOST.NAME}macro in the trigger name is used to tell us which host experienced the failure and will be replaced by the actual hostname in the problems list if the trigger is activated. This is not required and you can set the name to anything you like. Set the severity level to an appropriate value based on the type of issue. As failure to clean up temp files is not likely to bring the system down but is something that may warrant investigation I will set it to Warning in this case.
The expression field determines what Zabbix will use to determine if the trigger should be activated. Whenever the given expression evaluates to true it will activate the trigger and when it evaluates to false it will deactivate the trigger. What we are saying here is that when the last value of the temp.cleanup key in the System Maintenance template is not equal to 0 we should set an alert. To add this expression you can either enter it manually or click the Add button and fill in the resulting form as follows:
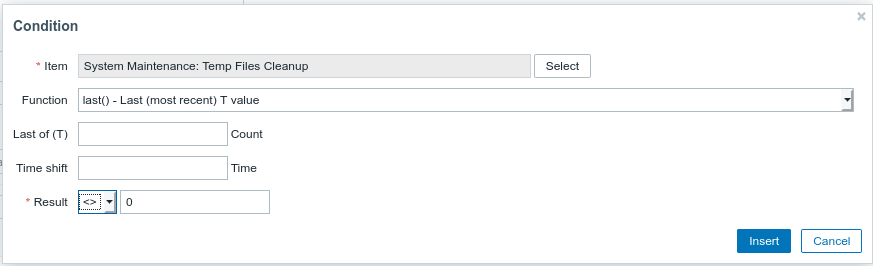
For new users, creating your expressions in this way is likely to be easier than learning the whole expression language in one go.
Click the Add button to save the trigger and then add another trigger to monitor when no data has been received for a period of time.
As before, we give the trigger a name, severity and expression to watch as follows:
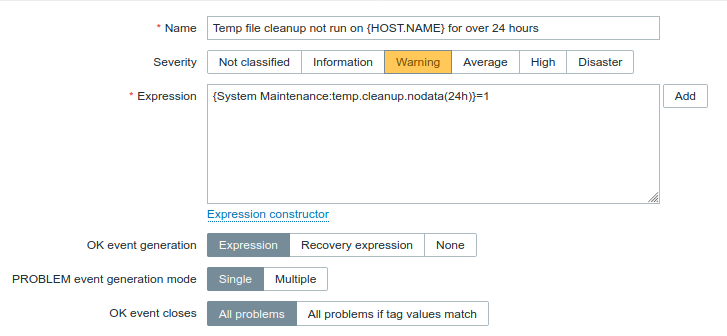
Here our expression will evaluate to true if no data has been received for the item in the last 24 hours and create a warning until data is received again. As the script is set to run every 24 hours and might take different amounts of time to run, you might find that this alert triggers for a couple of minutes every day while the script is running. If you run into this you can work around it by setting the nodata period slightly higher, for example 25 hours, to give the script enough time to run.
Click the Add button to add the trigger. You should now have two triggers set to monitor possible ways that the script may fail.
Testing
It is always worth testing your triggers to make sure they work as expected. Otherwise you might think you are monitoring something but you are actually not getting alerts when there are problems. To test that our first trigger is working correctly we can just manually run zabbix_sender and send it a non-0 value as follows:
zabbix_sender -c /etc/zabbix/zabbix_agentd.conf -s "$(hostname)" -k temp.cleanup -o 1This should cause an alert to be triggered and if we look in the problems tab on Zabbix we see that an alert has been generated.

We can clear this alert by running the zabbix_sender command again and passing a value of 0:
zabbix_sender -c /etc/zabbix/zabbix_agentd.conf -s "$(hostname)" -k temp.cleanup -o 0We should now see the problem enter the “Resolved” state.

Testing the no data received trigger can be done in two ways. Either disable the cron job, wait 24 hours and see if it generates an alert or set the time limit in the trigger expression to a shorter time such as 1 minute and then change it back once you see that the alert has been generated.
Integration into other languages
I have described how to use zabbix_sender in Bash and the same concept applies to other command shells such as CMD or PowerShell on Windows. If you are scripting in a different language, check the Zabbix website to see if they offer a module for the language you are using. If not, most languages have modules to allow you to run system shell commands from within your scripts. If this is the case, make sure you have zabbix_sender installed on the system and integrate the shell commands described above. In either case, the process for creating the template items and triggers within Zabbix will be the same regardless of the method you use to pass the data.